(Reporting Org Stats JSON)
Reporting Org: African Center for Economic Transformation (ACET)
Headlines
| View this Reporting Org elsewhere |
On D-Portal
On IATI Validator On the Dashboard API |
| Reporting Org's website | http://acetforafrica.org |
| Short Name |
acet
|
| Human Readable Name | African Center for Economic Transformation (ACET) |
| Reporting Org Ref |
US-EIN-11-3803281
|
| Reporting Org ref(s) in Data |
US-EIN-11-3803281
|
| Organisation Type | Regional NGO (23) |
| HQ Country | United States of America (the) (US) |
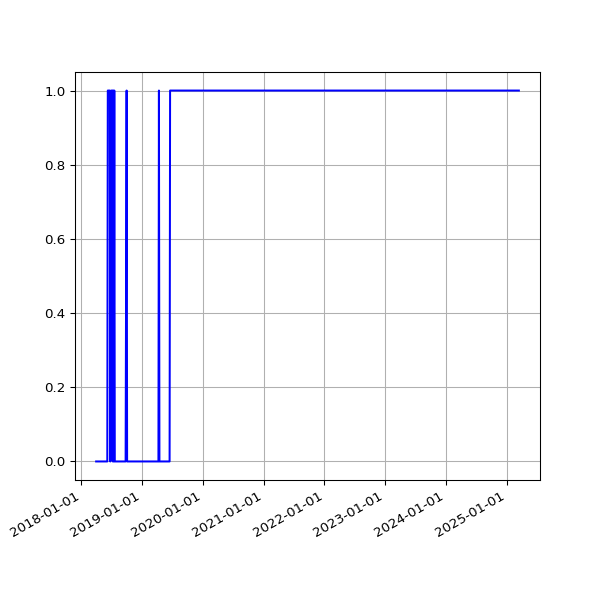
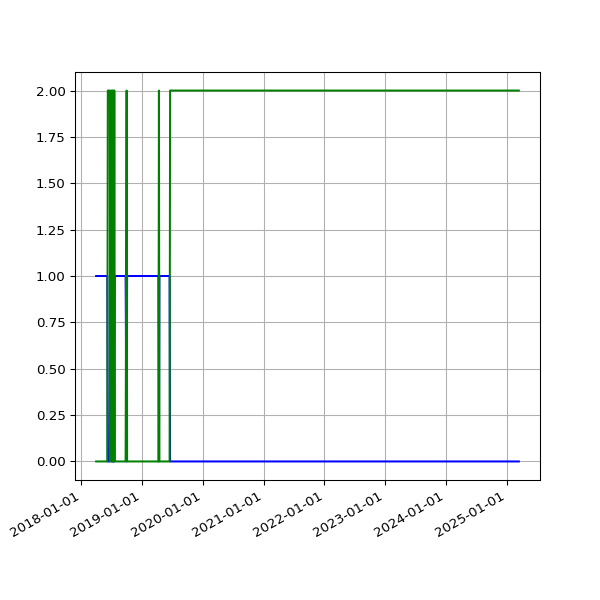
| Total Datasets | 2 |
| Datasets with Activity data | 1 |
| Datasets with Organisation data | 1 |
| Total File Size | 753.5 kB |
| Activities | 56 |
| Unique Activities | 56 |
| Organisations | 1 |
| Versions |
2.03
|
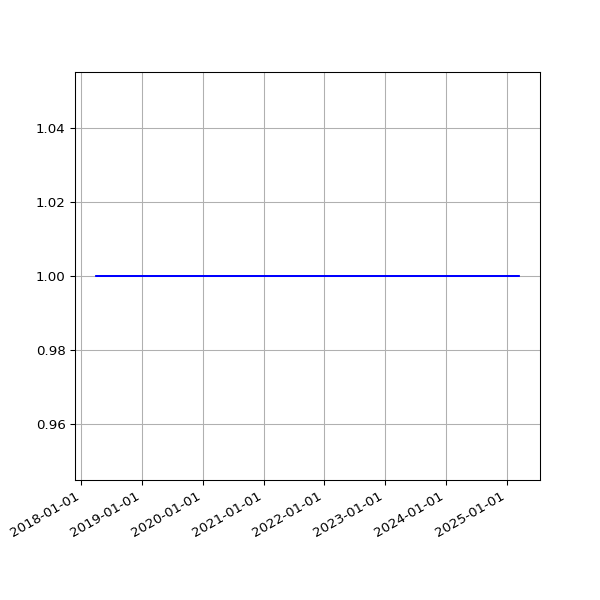
| Hierarchies |
1
|
| Licenses |
cc-by
|
| Files failing schema validation | 0 |
Activities
(J)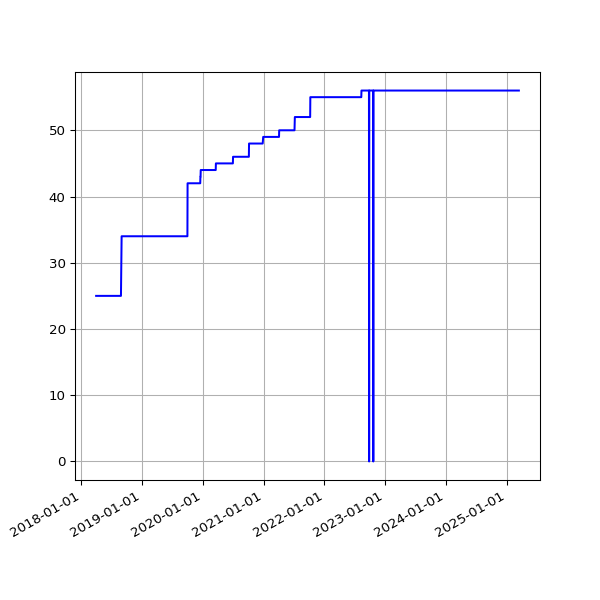


Errors
No issues were found.
Financial
Budgets
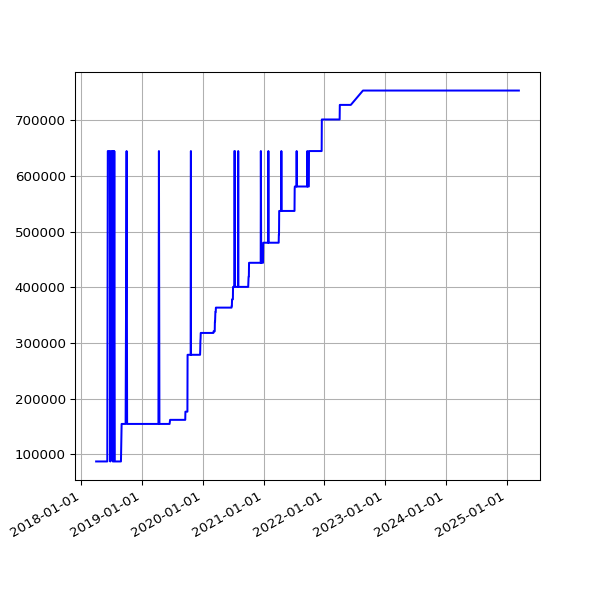
The below figures are calculated based on the data contained within the <budget> element for each reported activity. Original and revised elements are based on the value declared in the budget/@type attribute. Where budgets fall across two calendar years, the month of the <period-end> date is used to determine annual groupings, with budgets for periods ending January-June added to the previous calendar year.
| Year | Count (all) | Sum (all) | Count (Original) | Sum (Original) | Count (Revised) | Sum (Revised) |
|---|---|---|---|---|---|---|
| Total | 311 |
576615.03 USD |
300 |
19923091.26 USD |
||
| 2017 | 28 | 28 |
4744556.58 USD |
|||
| 2018 | 60 | 60 |
3748863.24 USD |
|||
| 2019 | 66 |
576615.03 USD |
55 |
3117561.5 USD |
||
| 2020 | 77 | 77 |
3933627.94 USD |
|||
| 2021 | 80 | 80 |
4378482.0 USD |
Exploring Data
Files
| Short Name | Links | Activities (J) | Organisations (J) | File Size (J) | Version (J) |
|---|---|---|---|---|---|
| acet-activities | Source Url IATI Validator | 56 | 0 | 752.9 kB | 2.03 |
| acet-org | Source Url IATI Validator | 0 | 1 | 656 Bytes | 2.03 |
(J)
Codelist Values (version 2.xx)
(J)
Elements and Attributes Published
Organisation Identifiers
| Org Type | Total | Self Refs | Excluding Self Refs | |||||||
|---|---|---|---|---|---|---|---|---|---|---|
| Org Elements | Refs | Non-Empty Refs | Org Elements | Refs | Non-Empty Refs | Valid Refs | Percentage of Org Elements with Valid Refs | |||
| Accountable | 0 | 0 | 0 | 0 | 0 | 0 | 0 | 0 | 0 | (J) |
| Extending | 0 | 0 | 0 | 0 | 0 | 0 | 0 | 0 | 0 | (J) |
| Funding | 53 | 0 | 0 | 0 | 53 | 0 | 0 | 0 | 0 | (J) |
| Implementing | 57 | 11 | 11 | 10 | 47 | 1 | 1 | 1 | 2 | (J) |
| Provider | 37 | 35 | 35 | 0 | 37 | 35 | 35 | 0 | 0 | (J) |
| Receiver | 32 | 32 | 32 | 0 | 32 | 32 | 32 | 0 | 0 | (J) |